+91 88 5151 3737 info@deezweb.com
Top 10 Marketing Initiatives to Try in 2023?

Top 10 Marketing Initiatives to Try in 2023?

As marketing trends are constantly evolving, it’s important to stay up-to-date with the latest marketing initiatives.
Here are 10 marketing initiatives to try in 2023:


Video Marketing

Video content continues to be a highly effective way to engage with your audience. In 2023, consider investing in video production to create engaging content that can be shared across social media, your website, and other digital channels.


Influencer Marketing

Partnering with influencers can help increase brand awareness, drive traffic to your website, and ultimately increase sales. In 2023, focus on finding influencers in your niche who align with your brand values and have a highly engaged following.


Personalization

Personalization is becoming increasingly important in marketing. In 2023, invest in data and analytics to personalize your marketing efforts and create a more tailored experience for your customers.


Voice Search Optimization

With the rise of voice assistants like Siri and Alexa, voice search optimization is becoming more important. In 2023, optimize your website and content for voice search to stay ahead of the curve.


Chatbots

Chatbots can help improve customer service and engagement by providing 24/7 support and quick responses to customer inquiries. In 2023, consider implementing a chatbot on your website or social media channels.


Artificial Intelligence

Artificial Intelligence (AI) can be used in marketing to analyze data, create personalized content, and optimize campaigns. In 2023, consider using AI to improve your marketing efforts and gain a competitive edge.


User-Generated Content

User-generated content is a powerful way to build trust with your audience and increase engagement. In 2023, encourage your customers to create and share content that showcases your products or services.


Interactive Content

Interactive content like quizzes, polls, and interactive videos can help increase engagement and keep your audience interested. In 2023, consider creating interactive content to stand out from the competition.


Social Media Advertising

Social media advertising can help increase brand visibility and drive traffic to your website. In 2023, consider investing in social media ads to reach a wider audience.


Customer Reviews

Customer reviews and ratings can help build trust with your audience and improve your search engine rankings. In 2023, encourage your customers to leave reviews and ratings on your website and other review sites.


In conclusion, implementing these 10 marketing initiatives in 2023 can help you stay ahead of the curve and drive business growth. Keep in mind that these initiatives are not one-size-fits-all and may require some trial and error to find what works best for your business.

Follow Us on Our Socials for the Latest Updates.
Share This Blog to Provide More Value.
What is Google Analytics and How does Google Analytics Work?

What is Google Analytics and How does Google Analytics Work?

What is Google Analytics?

Google Analytics is a web analytics service offered by Google that allows website owners to track and analyze their website traffic. It provides valuable insights into how visitors interact with a website, including the pages they visit, the time they spend on each page, and the actions they take, such as making a purchase or filling out a form.

With Google Analytics, website owners can see which pages are performing well and which ones are not, which can help them make data-driven decisions to improve their website and drive more traffic and conversions. The platform also provides valuable information about the demographics of website visitors, such as age, gender, and location, which can help website owners better understand and target their audience.

In this article, we will explore what Google Analytics is, how it works, and why it is important for website owners. We will also provide some tips for using Google Analytics to improve website performance, as well as some common keywords related to Google Analytics that can be used for search engine optimization (SEO).

Google Analytics, website traffic, website owners, website performance, SEO


What is Google Analytics?

How does Google Analytics work

Why is Google Analytics important for website owners

How to use Google Analytics to improve website performance

What common keywords are related to Google Analytics for SEO?


What is Google Analytics? A Comprehensive Guide for Website Owners.

As a website owner, it’s important to understand how visitors are interacting with your site. This is where Google Analytics comes in. Google Analytics is a web analytics service offered by Google that provides valuable insights into website traffic and visitor behavior. In this article, we will explore what Google Analytics is, how it works, and why it is important for website owners.

What is Google Analytics?

Google Analytics is a web analytics service that allows website owners to track and analyze their website traffic. It provides valuable information about how visitors interact with a website, including the pages they visit, the time they spend on each page, and the actions they take, such as making a purchase or filling out a form. Google Analytics can also provide information about the demographics of website visitors, such as age, gender, and location.

How does Google Analytics work?

Google Analytics works by adding a tracking code to the website. This tracking code sends data to the Google Analytics servers each time a visitor interacts with the website. The data includes information about the pages visited, the time spent on each page, and the actions taken by the visitor. This data is then processed by Google Analytics and displayed in the Google Analytics dashboard.

Why is Google Analytics important for website owners?

Google Analytics is important for website owners because it provides valuable insights into how visitors are interacting with the website. With this information, website owners can make data-driven decisions to improve website performance and drive more traffic and conversions. For example, if a website owner notices that a particular page has a high bounce rate, they can use this information to make improvements to the page to keep visitors engaged and on the site longer.


How to use Google Analytics to improve website performance.

There are many ways to use Google Analytics to improve website performance. Here are some tips:

Track website goals: Set up website goals in Google Analytics to track specific actions that visitors take on the website, such as filling out a form or making a purchase.

Analyze website traffic: Use Google Analytics to analyze website traffic to identify trends and patterns. For example, look at the most popular pages on the website and the pages with the highest bounce rate.

Analyze visitor behavior: Use Google Analytics to analyze visitor behavior to understand how visitors are interacting with the website. For example, look at the time visitors spend on the site, the pages they visit, and the actions they take.

Improve website content: Use the insights from Google Analytics.


How important is Google Analytics?

Google Analytics is extremely important for website owners, as it provides valuable insights into website traffic and visitor behavior. Without Google Analytics, website owners would be left in the dark about how visitors are interacting with their websites. Here are some reasons why Google Analytics is important:

It provides valuable insights: Google Analytics provides valuable insights into website traffic and visitor behavior, which can help website owners make data-driven decisions to improve website performance and drive more traffic and conversions.

It helps track website goals: Google Analytics allows website owners to set up website goals to track specific actions that visitors take on the website, such as filling out a form or making a purchase.

It helps optimize website content: With the insights from Google Analytics, website owners can optimize the website content to keep visitors engaged and on the site longer. For example, if a website owner notices that a particular page has a high bounce rate, they can use this information to make improvements to the page to keep visitors engaged.

It helps improve website usability: Google Analytics can provide valuable information about how visitors are interacting with the website, which can help website owners improve website usability. For example, if a website owner notices that visitors are dropping off at a particular point in the checkout process, they can use this information to make improvements to the checkout process to make it more user-friendly.

It helps with SEO: Google Analytics can provide valuable information about the keywords that visitors are using to find the website, which can be used for search engine optimization (SEO). Website owners can use this information to optimize website content for relevant keywords to improve search engine rankings.

Overall, Google Analytics is a powerful tool that provides valuable insights into website traffic and visitor behavior. It is a must-have for any website owner who wants to improve website performance and drive more traffic and conversions.


How to install Google Analytics?

To install Google Analytics, follow these steps:

Sign up for a Google Analytics account: Go to the Google Analytics website and sign up for an account. You will need a Google account to sign up.

Create a new property: Once you have signed up for an account, you will need to create a new property. A property is a website or app that you want to track with Google Analytics. To create a new property, click on the “Admin” tab and then click on the “Create Property” button.

Enter website information: You will need to enter information about your website, such as the website name, website URL, and industry category.

Get tracking code: After you have created a new property, you will be provided with a tracking code. This code needs to be added to your website to track visitor behavior. To get the tracking code, go to the “Tracking Info” tab and click on “Tracking Code.”

Add tracking code to the website: There are several ways to add the tracking code to your website. One way is to add the tracking code to the header of your website. This can be done by copying the tracking code and pasting it into the header section of your website’s HTML code.

Verify tracking: After you have added the tracking code to your website, you will need to verify that it is working. You can do this by going to the “Real-Time” tab in Google Analytics and checking to see if your website is being tracked.

Once you have installed Google Analytics, you will be able to track website traffic and visitor behavior. You can use this information to make data-driven decisions to improve website performance and drive more traffic and conversions.


How do Accounts, Properties, and Views work?

Google Analytics is organized into three levels: Accounts, Properties, and Views. Here is how each level works:

Accounts: An account is the highest level in Google Analytics. It represents the top-level container for all of your Google Analytics properties. You can have multiple accounts, which is useful if you have multiple businesses or organizations that you want to track separately. When you sign up for Google Analytics, you will create an account.

Properties: A property represents a website or app that you want to track with Google Analytics. Each property has a unique tracking ID, which is used to track visitor behavior on the website or app. You can have multiple properties under one account, which is useful if you have multiple websites or apps that you want to track separately. When you create a new property, you will be provided with a tracking ID.

Views: A view is a customized perspective of a property. Views allow you to apply filters to the data to exclude certain traffic or show only specific subsets of data. For example, you can create a view that excludes traffic from internal IP addresses or a view that only shows data for a specific country. Each property can have multiple views, which is useful if you want to look at the data in different ways. When you create a new view, you will be able to choose which filters to apply to the data.

To summarize, accounts, properties, and views in Google Analytics work together to help you organize and analyze your website or app data. An account represents the top-level container for all of your Google Analytics properties. A property represents a website or app that you want to track with Google Analytics. A view is a customized perspective of a property that allows you to apply filters to the data.


Organizing your accounts and properties.

Organizing your Google Analytics accounts and properties is important for several reasons. It makes it easier to manage multiple websites or apps, it helps you understand your website or app data better, and it makes it easier to collaborate with other users. Here are some tips for organizing your accounts and properties in Google Analytics:

Create separate accounts for different businesses or organizations: If you have multiple businesses or organizations, it’s a good idea to create separate accounts for each one. This makes it easier to manage the data for each business or organization separately.

Group similar properties together: If you have multiple websites or apps that are similar, group them together in the same account. For example, if you have several e-commerce websites, group them together in the same account.

Use descriptive names: Use descriptive names for your accounts and properties. This makes it easier to identify them and understand what they represent.

Use a consistent naming convention: Use a consistent naming convention for your accounts and properties. For example, you might use the business name followed by the website name. This makes it easier to search for and find specific accounts and properties.

Use views to customize your data: Use views to create customized perspectives of your data. For example, you might create a view that excludes traffic from internal IP addresses or a view that only shows data for a specific country.

Use user management to control access: Use user management to control access to your accounts and properties. This allows you to give other users access to specific accounts and properties without giving them access to all of your data.

By following these tips, you can organize your Google Analytics accounts and properties in a way that makes it easier to manage your data and understand your website or app performance.


What are The Most Common Questions When Implementing The Tracking Code?

When implementing the tracking code in Google Analytics, there are a few common questions that may come up. Here are some of the most common questions:


Where do I place the tracking code on my website?

The tracking code should be placed in the header section of your website’s HTML code. This ensures that the tracking code is loaded before the website content, allowing it to collect data on visitor behavior.

Do I need to install the tracking code on every page of my website?

Yes, you need to install the tracking code on every page of your website. This ensures that you can collect data on visitor behavior across your entire website.

How long does it take for data to show up in Google Analytics?

It can take up to 24-48 hours for data to show up in Google Analytics. This is because it takes some time for the tracking code to collect and process data from your website.

How do I know if the tracking code is working?

You can use the Real-Time reports in Google Analytics to see if the tracking code is working. You should be able to see live data on visitor behavior on your website.

What do I do if the tracking code isn't working?

If the tracking code isn’t working, there are a few things you can try. First, make sure that the tracking code is installed correctly on your website. You can also check to see if there are any errors in the tracking code by using the Tag Assistant extension for Google Chrome. If you’re still having issues, you can contact Google Analytics support for assistance.


By addressing these common questions when implementing the tracking code, you can ensure that you’re collecting accurate and useful data on visitor behavior on your website.


What are the main metrics of Google Analytics?

Google Analytics provides a wide range of metrics to help you understand visitor behavior on your website. Here are some of the main metrics you’ll find in Google Analytics:

Sessions: A session is a period of time during which a visitor interacts with your website. A session ends after 30 minutes of inactivity or at midnight.

Users: A user is a unique visitor to your website. Google Analytics uses cookies to track users, so if a visitor clears their cookies or uses a different device, they will be counted as new user.

Pageviews: A pageview is counted each time a visitor views a page on your website. If a visitor refreshes the page or returns to the same page later, it will count as a new pageview.

Bounce rate: The bounce rate is the percentage of visitors who leave your website after viewing only one page. A high bounce rate can indicate that visitors aren’t finding what they’re looking for on your website.

Time on page: The average time on page is the amount of time visitors spend on a particular page on your website. This metric can help you understand which pages are engaging visitors and which ones may need improvement.

Conversion rate: The conversion rate is the percentage of visitors who take a specific action on your website, such as making a purchase or filling out a form. A high conversion rate is a sign that your website is effectively meeting your business goals.

Exit rate: The exit rate is the percentage of visitors who leave your website after viewing a particular page. This metric can help you identify which pages may be causing visitors to leave your website.

Referral traffic: Referral traffic is the traffic that comes to your website from other websites. This metric can help you understand which websites are driving traffic to your website.

These are just a few of the many metrics available in Google Analytics. By tracking these metrics and others, you can gain valuable insights into visitor behavior on your website and make informed decisions to improve your website’s performance.


What is a bounce rate?

Bounce rate is a metric in Google Analytics that represents the percentage of visitors who leave your website after viewing only one page. A high bounce rate can indicate that visitors are not finding what they are looking for on your website or that the page they land on is not engaging enough to keep them on your site.

The bounce rate is calculated by dividing the number of single-page sessions by the total number of sessions on your website. For example, if you have 100 sessions and 40 of those sessions only have one pageview, then your bounce rate would be 40%.

It’s important to note that not all bounces are bad. For example, if a visitor comes to your website and finds exactly what they were looking for on the first page, they may leave without visiting other pages. This can result in a high bounce rate, but it’s not necessarily a bad thing.

However, a high bounce rate can also indicate that there are issues with your website, such as slow loading times, poor user experience, irrelevant content, or confusing navigation. In this case, it’s important to identify the pages with high bounce rates and address the issues to improve the user experience and keep visitors on your website for longer periods of time.

Overall, bounce rate is an important metric to monitor in Google Analytics as it can provide valuable insights into how visitors are interacting with your website and help you make informed decisions to improve the user experience and achieve your business goals.


What is the “Time” on the “Page” and “Session Duration”?

Time on page and session duration are both metrics in Google Analytics that provide information about how long visitors are spending on your website.

Time on page is the amount of time that a visitor spends on a specific page on your website before leaving. This metric is calculated by measuring the time between the first pageview and the last interaction with the page before the visitor leaves. It’s important to note that if a visitor leaves a page without clicking on anything, their time on that page will be recorded as 0.

Session duration, on the other hand, is the amount of time that a visitor spends on your website during a single session. A session is defined as the period of time that a visitor is actively engaged with your website. This metric includes the time spent on all pages visited during a session, as well as any time spent inactive or idle on your website.

Both times on page and session duration can provide valuable insights into how engaged visitors are with your website. For example, a high time on page or session duration can indicate that visitors are finding your content engaging and are spending a significant amount of time-consuming it. On the other hand, a low time on page or session duration may suggest that visitors are not finding your content engaging or are having trouble navigating your website.

It’s important to note that both metrics have limitations. For example, time on the page does not measure the amount of time that a visitor spends on your website if they only visit one page. Session duration, on the other hand, can be impacted by factors such as leaving a tab open in their browser or not fully closing out of a session. However, by using these metrics in conjunction with other data points in Google Analytics, you can gain a more complete understanding of how visitors are engaging with your website and make informed decisions to improve the user experience.


What is the difference between Channel, Source, and Medium?

In Google Analytics, channels, sources, and mediums are all related to how visitors find and interact with your website. However, there are some key differences between these terms.

A channel is a category of sources that group visitors based on how they arrived at your website. Channels include organic search, direct, referral, social, email, and others. For example, if a visitor finds your website through a search engine, they would be grouped into the organic search channel. If they clicked on a link from another website, they would be grouped into the referral channel.

A source is the origin of traffic to your website. It tells you where your visitors are coming from. Examples of sources include Google, Facebook, Twitter, and a specific domain name. In other words, the source is the website or platform that referred the visitor to your website.

A medium is a type of traffic that groups visitors based on the way they arrived at your website. It provides more detail about the source of traffic. Examples of mediums include organic search, CPC (cost-per-click), referral, email, and social. For example, if a visitor comes to your website from a Google search, the source would be Google and the medium would be organic search.

To summarize, the main difference between these terms is that channels group visitors based on how they arrived at your website, sources tell you where the traffic is coming from, and mediums provide more detail about the type of traffic. Understanding these terms and the differences between them can help you better analyze your traffic sources and optimize your marketing efforts to drive more traffic and conversions to your website.


How do Goals and Conversions work in Analytics?

Goals and conversions are important metrics in Google Analytics that can help you track and measure the success of your website in achieving specific objectives.

A goal in Google Analytics is a specific action that you want visitors to take on your website. Goals can include things like making a purchase, filling out a contact form, downloading a file, or spending a certain amount of time on a page. When you set up a goal in Google Analytics, you can track how many times that goal has been completed and the conversion rate.

A conversion is the completion of a goal. For example, if your goal is for a visitor to make a purchase, a conversion would occur when a visitor completes the purchase process on your website. Conversions can provide valuable insights into how effective your website is at achieving its objectives.

To set up goals and track conversions in Google Analytics, you will need to define the goal type and configure the goal details. There are several types of goals to choose from, including destination, duration, pages/screens per session, and event. Once you’ve defined your goal, you can track its completion in the Conversions section of Google Analytics.

It’s important to note that goals and conversions can provide valuable insights into the effectiveness of your website and marketing efforts. By tracking these metrics, you can identify areas where your website is performing well and areas where you may need to make improvements. Additionally, you can use this data to optimize your marketing campaigns to drive more conversions and achieve your business objectives.


How do Primary and Secondary Dimensions work in Google Analytics?

In Google Analytics, dimensions are attributes of your website data that can be used to slice and analyze your metrics. Dimensions provide more detailed information about your website visitors and their behavior.

Primary dimensions in Google Analytics are the main dimensions that are displayed in your reports by default. These dimensions are displayed on the left-hand side of your report, and they typically include things like source, medium, device category, location, and landing page. Primary dimensions are used to group your data and provide an overview of your website’s performance.

Secondary dimensions are additional dimensions that you can add to your reports to provide more detail about your primary dimensions. For example, if you are looking at a report that shows traffic by source, you could add a secondary dimension to show the device category or the landing page. This would give you more detailed insights into how your website visitors are interacting with your website.

To add a secondary dimension in Google Analytics, simply click on the “Secondary dimension” drop-down menu and select the dimension you want to add. You can add multiple secondary dimensions to your reports to get a more detailed view of your website data.

Using primary and secondary dimensions in Google Analytics can help you better understand your website visitors and their behavior. By analyzing your data using different dimensions, you can identify trends, opportunities, and areas for improvement on your website. Additionally, you can use this data to optimize your website and marketing efforts to drive more traffic and conversions to your website.


How to create and monitor events?

Events in Google Analytics are user interactions with your website, such as clicks, form submissions, video plays, and other types of interactions. Tracking events can provide valuable insights into how visitors are interacting with your website, which can help you optimize your website for better performance.

Here are the steps to create and monitor events in Google Analytics:

Set up event tracking: First, you will need to set up event tracking on your website. This involves adding code to your website that tracks specific user interactions. You can track events using Google Tag Manager or by adding code directly to your website.

Define event categories, actions, and labels: Once you have set up event tracking, you will need to define the categories, actions, and labels for your events. This will help you organize and analyze your event data.

Set up event goals: You can set up event goals in Google Analytics to track how often specific events occur on your website. This can help you measure the effectiveness of your website and marketing efforts.

Monitor your event data: After you have set up event tracking and defined your event categories, actions, and labels, you can start monitoring your event data in Google Analytics. You can view your event data in the Behavior section of Google Analytics, under the Events tab.

Analyze your event data: Analyzing your event data can help you identify trends, opportunities, and areas for improvement on your website. You can use this data to optimize your website for better performance and drive more conversions.

By creating and monitoring events in Google Analytics, you can gain valuable insights into how visitors are interacting with your website. This can help you make data-driven decisions to improve your website and achieve your business goals.


How to create custom reports in Google Analytics?

Custom reports in Google Analytics allow you to create reports that are tailored to your specific needs and requirements. You can create custom reports that include the metrics and dimensions that are most important to you, and that provide the insights you need to make informed decisions about your website and marketing efforts. Here are the steps to create custom reports in Google Analytics:

Navigate to the Customization tab: To create a custom report, navigate to the Customization tab in Google Analytics. You can find this tab in the left-hand sidebar.

Click on the “New Custom Report” button: Once you are on the Customization tab, click on the “New Custom Report” button to begin creating your custom report.

Define your custom report: In the “Edit Custom Report” section, you can define your custom report by selecting the metrics and dimensions you want to include. You can also specify filters, segments, and other options to customize your report.

Save your custom report: Once you have defined your custom report, click on the “Save” button to save your report. You can give your report a name and description, and you can also specify who has access to the report.

View and analyze your custom report: After you have saved your custom report, you can view and analyze your data by navigating to the Custom Reports section of Google Analytics. Here, you can select your custom report and view the data in a customized report.

Custom reports in Google Analytics can help you gain valuable insights into your website’s performance and user behavior. By creating custom reports that are tailored to your specific needs, you can make more informed decisions about your website and marketing efforts, and optimize your website for better performance and results.


Why does Google Analytics spam occur and how to avoid it?

Google Analytics spam occurs when fake or spammy data is recorded in your Google Analytics account. This can happen when spammers or bots send fake traffic to your website, which can skew your data and make it difficult to get an accurate understanding of your website’s performance.

Here are some of the main reasons why Google Analytics spam occurs:

To generate traffic: Some spammers send fake traffic to websites to generate more traffic and increase their website’s ranking in search engines.

To skew data: Other spammers send fake traffic to websites to skew data and make it more difficult for website owners to understand their website’s performance.

To promote products: Some spammers use Google Analytics spam to promote their products or services, by making it appear as though they are driving a lot of traffic to their website.

To avoid Google Analytics spam, there are several steps you can take:

Use filters: Google Analytics allows you to set up filters to exclude certain types of traffic from your data. For example, you can set up filters to exclude traffic from known spam domains or IP addresses.

Enable bot filtering: Google Analytics has a built-in bot filtering feature that can help you exclude known bots and spiders from your data.

Verify your tracking code: Make sure your Google Analytics tracking code is installed correctly on your website, and that it is not being modified or tampered with by spammers or bots.

Monitor your data: Regularly monitor your Google Analytics data to identify any suspicious or unusual traffic patterns. If you notice any unusual traffic, you can take steps to investigate and block it.

By taking these steps, you can help prevent Google Analytics spam and ensure that your data is accurate and reliable. This can help you make more informed decisions about your website and marketing efforts, and achieve better results over time.


What is Google Analytics 360?

Google Analytics 360 is a premium version of Google Analytics that is designed for larger enterprises and organizations that require advanced analytics features and capabilities. Google Analytics 360 includes a range of advanced features and integrations that are not available in the standard version of Google Analytics.

Here are some of the key features of Google Analytics 360:

Advanced data processing: Google Analytics 360 uses a more advanced data processing engine that can handle higher volumes of data and provide more accurate and timely insights.

Unsampled reporting: Google Analytics 360 allows you to view unsampled reports, which can provide a more accurate view of your website’s performance.

Data-driven attribution: Google Analytics 360 includes data-driven attribution modeling, which uses advanced algorithms to determine which marketing channels and campaigns are driving the most conversions.

Advanced integrations: Google Analytics 360 integrates with a range of other Google marketing and advertising products, including DoubleClick, Google Tag Manager, and Google BigQuery.

Support and training: Google Analytics 360 includes access to a dedicated support team and advanced training resources, to help you get the most out of the platform.

Google Analytics 360 is designed for larger enterprises and organizations that require more advanced analytics features and capabilities. It can provide a more accurate and comprehensive view of your website’s performance, and help you make more informed decisions about your marketing and advertising efforts. However, it is also more expensive than the standard version of Google Analytics, and may not be necessary for smaller organizations or websites with lower traffic volumes.


How much does Google Analytics 360 cost?

Google Analytics 360 is a premium version of Google Analytics that includes a range of advanced features and capabilities. However, it is also more expensive than the standard version of Google Analytics.

The cost of Google Analytics 360 varies depending on several factors, including the size of your organization, the amount of traffic your website receives, and the level of support and training you require. Generally, the cost of Google Analytics 360 can range from tens of thousands of dollars to hundreds of thousands of dollars per year.

To get an accurate quote for Google Analytics 360, you will need to contact a Google Analytics 360 sales representative. They can provide you with more information about the features and pricing of Google Analytics 360, and help you determine if it is the right fit for your organization’s needs and budget.


What are the benefits of Google Analytics 360?

Google Analytics 360 is a premium version of Google Analytics that offers a range of advanced features and capabilities that are not available in the standard version of Google Analytics.
Here are some of the key benefits of Google Analytics 360:

Advanced data processing: Google Analytics 360 uses a more advanced data processing engine that can handle higher volumes of data and provide more accurate and timely insights.

Unsampled reporting: Google Analytics 360 allows you to view unsampled reports, which can provide a more accurate view of your website’s performance.

Data-driven attribution: Google Analytics 360 includes data-driven attribution modeling, which uses advanced algorithms to determine which marketing channels and campaigns are driving the most conversions.

Advanced integrations: Google Analytics 360 integrates with a range of other Google marketing and advertising products, including DoubleClick, Google Tag Manager, and Google BigQuery.

Support and training: Google Analytics 360 includes access to a dedicated support team and advanced training resources, to help you get the most out of the platform.

Customization and flexibility: Google Analytics 360 offers more customization options and flexibility than the standard version of Google Analytics, allowing you to tailor the platform to meet the specific needs of your organization.

Enhanced data security: Google Analytics 360 includes advanced security features and protocols to help protect your data and ensure compliance with data privacy regulations.

Overall, Google Analytics 360 can provide a more accurate and comprehensive view of your website’s performance, and help you make more informed decisions about your marketing and advertising efforts. However, it is also more expensive than the standard version of Google Analytics, and may not be necessary for smaller organizations or websites with lower traffic volumes.


Conclusion

In conclusion, Google Analytics is a powerful web analytics platform that can provide valuable insights into the performance of your website, marketing campaigns, and user behavior. By using Google Analytics, you can gain a better understanding of your audience, track key metrics such as traffic, engagement, and conversions, and make data-driven decisions to optimize your online presence.

While the platform can be complex and overwhelming at first, it offers a range of tools and features to help you customize your reporting and gain insights into the metrics that matter most to your business. Whether you are using the standard version of Google Analytics or the premium Google Analytics 360, the platform can be a valuable asset for any organization looking to improve its online performance and marketing efforts.

Follow Us on Our Socials for the Latest Updates.
Share This Blog to Provide More Value.
How to Create a Slogan for Your Brand ?

How to Create a Slogan for Your Brand ?

How to create a slogan for your Brand?

Difference between A Tagline & A Slogan:-

A Tagline is to represent a Business or a Company whereas Slogan is for a Single Product or is a part of an Advertising Campaign.

Tips to Create a Killer Slogan:-

  1. Keep it short & simple.
  2. Think about your target audience.
  3. Timeless.
  4. Make it Rhyme. (If Possible)
  5. Provide a reason to buy.
  6. Should create a positive image.
  7. Stay Honest.


Let me know if this was useful

#websitedesigner #graphicdesigner #webdevelopment #digitalmarketing #entrepreneurs

#uidesigner #entrepreneurship #entrepreneurlifestyle #seo #smo #smm #ecommerce


What is SERP and How Does it Work ?

What is SERP and How Does it Work ?

Today we will know what is what is SERP. We know that there are millions of pages on the internet but only a few of us are required to do according to our search. So whenever you do some searches on Internet, then you show Search Results about it. Or we can say that whenever someone searches through a keyword on a search engine, then you find Search Results listed according to your query in Search Results. These Search Pages are also called SERP.

In this case, the importance of SERP ( Search Engine Results Pages ) increases even more Because if you are a blogger and if your content is showcased in Google’s SERP then Organic Traffic will automatically come to your blog. This will give you a very good traffic. But it is not easy to come first in the SERP because there is very much competition for it. So it is very important to know how SERP works and how we can rank our contents in SERP’s Top Pages, which will greatly increase our visibility. So today we will get complete information about what is the SERP and how it matters. Then let’s begin without delay and know about what the SERP is.
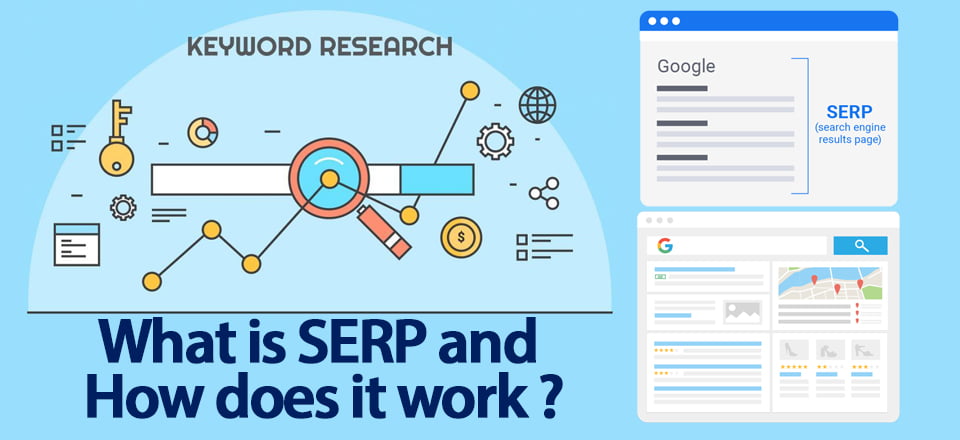
 

What is SERP ?

Simply put, SERP is called those Web pages that search engine shows when you search for a keyword. Major Search Engines mainly display three types of listings in their SERPs:

  1. Listings that have been indexed by Search engine spider
  2. Listings that have been Indexed by any person in the Search engine’s directory
  3. Listings who have paid for them to List in Search Engine

The SERP is Full of Form “Search Engine Results Pages”. Who do not know these Term SERP is an acronym. Whenever you do a Google query create then look at the pages you search results that are SERP.

Your Rank SERP which it Page Rank is also called. So obvious thing is if your Page Rank high then automatically he will Show in Pages first Search results. And which on its own will come more people to your website and will increase impression on your site. Statistics of these have been found to be more than 75% of people do not go beyond Search The time First Page. So much becomes necessary for a legitimate thing to come on the First Page.


Search Engine Results Pages : What It Is and How It Works

Search Engine Result Pages are web pages that serve users when they search something online, with the help of Google like Search Engine. When users enter their Search query (where they primarily use specific term or phrases, which are also called keywords), in which Search Engine provides them SERP.

All SERPs are unique, even if they are not used in the same search engine, by using similar keywords and search queries. That’s because all Search engines virtually present their results according to their user experience. Which depends on many factors such as User’s Physical Location, browsing history and Social Settings. Two SERPs can look identical, but they both have a difference.

SERPs are constantly changing because search engines like Google, Bing and other Search Engines providers try to provide even better results to their users. They constantly change their Search Technology so today’s SERPs are very different from their former SERP.


Organic Results

SERPs consist mainly of two types of content – “Organic” results and paid results. Organic Results are those web pages that appear according to the Search Engine’s Algorithms. SEO Professionals who specialize in optimizing web content and have a great hand in ranking the website, they work more on these organic results.

Some SERPs show more organic results than others, because that is because different searches have different intentions. There are mainly three primary types of Internet Search :

  1. Informational
  2. Navigational
  3. Transnational

Informational searches

Those searches are called where the user thinks they will get information on any topic. There is no point in putting ads in this type of SERP because they are low commercial intent. Here people will not come to buy anything.

Navigational queries

Tell them where users want to locate a particular website through their search. In this case, it may be possible that the user does not know the exact URL of any website and he is trying to scudded it from Search.

Finally,

Transnational Searches

They are called where Paid results are mainly displayed in SERP. Transnational searches are of high commercial intent and in some search terms such as “buy”, it is quite certain that it creates a desire to buy something in the minds of users.


Paid Results

Contrary to Organic Results, the results of paid results in paid search results are given by Advertisers. If we talked about earlier then Paid Results used to be quite small, mainly used to be text based ads. Which are displayed above the organic results.

Therefore, the use of paid results can only be done by those who have money available for investment. These are very costly compared to organic results.


SERP’s Popular Features

Here you will be discussing some of the very popular features of SERP with people about which you may have been unaware of yet. So let us know about them well.

Adwords (Bottom)

Description : Traditional Adwords ads come in many types, but the most common type of all these are those which are displayed in the Top and Bottom, Top and Bottom Organic Results of Left-hand column. All ads are next to the Colored Label.

Obtainability : Ads are ranked primarily how relevant they are and how useful they are for those who are searching for them. It depends on just a few reasons.

Adwords (Top)

Description : Traditional Adwords ads come in many types, but the most common type of all these are those which are displayed in the Top and Bottom, Top and Bottom Organic Results of Left-hand column. All ads are next to the Colored Label.

Obtainability : Ads are ranked primarily how relevant they are and how useful they are for those who are searching for them. It depends on just a few reasons.


Featured Snippet

Description : Whenever Google requires a question and does not have the core knowledge graph, then he tries to find the same answer in the index. This is done by preparing the result of a special class of Organic result, where information from main target page is present and present.

High CTRs of Featured Snippets are compared to regular organic results.

Obtainability : Featured Snippets, often spaced everywhere:

  • It usually remains at the first page of the SERP
  • It is often extracted from the main page, which correctly answers the query from anyone
  • It holds more importance for those pages which have already been ranked in 1-5 of any Search query.


Image Pack

Description: Images Packs are called results that show up on the horizontal row of an image link, and if you click on it you will get Google Image Search. Images Packs can appear in any Organic Position.

Obtainability: Image Packs are called special results which only appear when a particular search is searched and visual content is the most valuable. They use Ranking rules more than Core organic algorithm.

With Image Content, it is recommended that some best practices also be followed, such as:

  1. Descriptive file name
  2. Descriptive alt text
  3. Human-readable URL
  4. Optimized image size
  5. Title attribute included


In-Depth Article

Description : For any broad and ambiguous terms, Google blocks a “in-depth” article, which is almost indistinguishable compared to organic results. They follow different ranking rules, which are different from the core organic results and are dominated by large publishers. Every block has three articles and which occupies an organic position.

Obtainability : Mainly winning in-depth articles exclusively large and high authoritative publishers. Those who have certain specializations:

  1. long-form content (2000-5000 words)
  2. Schema article markup
  3. Authorship Markup
  4. Unique, high-quality writing


Knowledge Card

Description : Knowledge Cards (which are part of the Knowledge Graph) make a very big ground cover, from semantic data human-edited sources to semantic data which is extracted from Google Index, and private data partnership too.

These are mainly appearing in top of SERP in Desktop Search.

Obtainability : All Knowledge Card results are either based on Human-edited data or they appear on the results of data agreements with partners. For this reason appearing in the Knowledge Card is very funny for any site.

It is very important to know which keywords have been affected by the Knowledge Graph, because knowing this will enable us to prioritize the keywords, with the help of knowing how Google entity stores the data.


Knowledge Panel

Description : As soon as Knowledge Panels (aka Knowledge Graph) Knowledge Cards, the semantic data is extracted from many sources such as human-edited sources such as Wiki Data, along with which the data is extracted from Google index and its As well as private data partnerships.

These are mainly appearing in the right of SERP in Desktop Search.

Obtainability : All Knowledge Panel results are either based on Human-edited data or they appear on the results of data agreements with partners. For this reason, appearing in the Knowledge Panel is very funny for any site.

It is very important to know which keywords have been affected by the Knowledge Graph, because knowing this will enable us to prioritize the keywords, with the help of knowing how Google entity stores the data.


Local Pack

Description : The keywords which Google thinks of having Local Intent in them are SERP always contained in a Local Pack where the three most important physical locations selected by Google are kept.
This feature always dominates the SERP in Mobile.

Obtainability : Local SEO has changed a lot in the past few years and just local features are evolve very soon. If you have a local business, then you also need to be familiar with Google’s Local Space.


Local Teaser Pack

Description : As soon as a local pack, a local business result of a three pack is shown which is shown in the map, along with some additional information such as opening hours, reviews, images etc.

Obtainability : Local SEO has changed a lot in the past few years and just local features are evolve very soon. If you have a local business, then you have to get familiar with Google’s local space soon.


News Box

Description : Time-sensitive and newsworthy topics can generate a block of results through Google News. Since the “in the news” update has come in 2014, many sites have been able to rank in the news block since then.

Obtainability : Finding results from Google News is a very different process that is very different from Organic results.


Related Questions

Description : Related questions show cards algorithmically – generated questions that Google thinks are related to Search. All questions seem to expand as if they are a feature snippet. Related questions are mixed with Organic Results and their location may vary in SERP.

Obtainability : Related Questions It may seem like they are related to Featured Snippets in some way. In most cases:

  1. Related question is also called keywords with Featured snippets
  2. Who is the winner in Featured Snippet, the related question is also called winner
    By winning in the related question, you may see a small CTR bumps. But Related Questions helps us find the Featured Snippet keyword opportunities.


Reviews

Description : Review stars and rating data are sometimes displayed for products, recipes, and other relevant items too. Review / rating data is always shown in the Destination URL and Snippet.

Results which have a higher rating, have a higher CTR.

Obtainability : Google Rules on which the Stars depend on the results in the results has not been published yet, and they differ according to the industry. But at least it is necessary to be in the page of Schema Markup for review.


Shopping Results

Description : Paid Shopping results or Product Listing Ads (PLAs) that are used are directly for selling products, they are very rich information such as images and pricing.

Obtainability : As soon as Adwords, Shopping is also a Paid Placement.

Whether you are in a Paid search business or not, but this is a very good thing to know about when you are competing with Paid Resulst for Organic results.


Site Links

Description : Google always displays the 10 pack of 10 site links while searching for any exact domain. In this full pack, 5 organic positions that dominate in SERP remain intact.

Site Links can help your site in something like this:

  1. Generating High CTR from SERP
  2. By reaching users as soon as possible to their needs

Obtainability : The three main reasons that drive the site links to appear in the SERP:

  1. Type of query – Site Links which appear on main branded terms
  2. Site traffic – Site links which are mainly appearing in large branded sites with high traffic
  3. Applying Search Action anchor markup to your site


Tweet

Description : From 2015, Google has started displaying Tweets directly in SERP, which is mixed with organic results and displayed. Unlike Google+ results, Twitter does not have any effect on personalization.

Obtainability : Twitter’s results are not organic in general sense, but they raise the visibility of any brand in SERP.


Videos

Description : thumbnail is displayed in Video results (especially YouTube). They used to be the first true vertical but they seem to be more organic growth.

Obtainability :  Video results appear only for a few keywords. It is very important to have video schema markup at least in the page.


By now you have come to understand what SERP is and how it works. So, if you have a website or a blog, then how important is it to get into the top page of SERP? I sincerely hope that I gave you complete information about what SERP people do and how it works and I hope you guys have understood about SERP. I am convinced of all the readers that you too share this information with your neighbors, relatives, friends, so that we will be aware of our interactions and this will greatly benefit everyone. I need you people’s support so that I can bring you even more new information.

My always try is to do that I always help my readers or readers on every side, if you have any doubt of any kind, then you can ask me unexpectedly. I will definitely try to solve those Doubts. Please tell us how you think this article is SERP and how it works, so let us know how to learn something from your thoughts and improve it.